
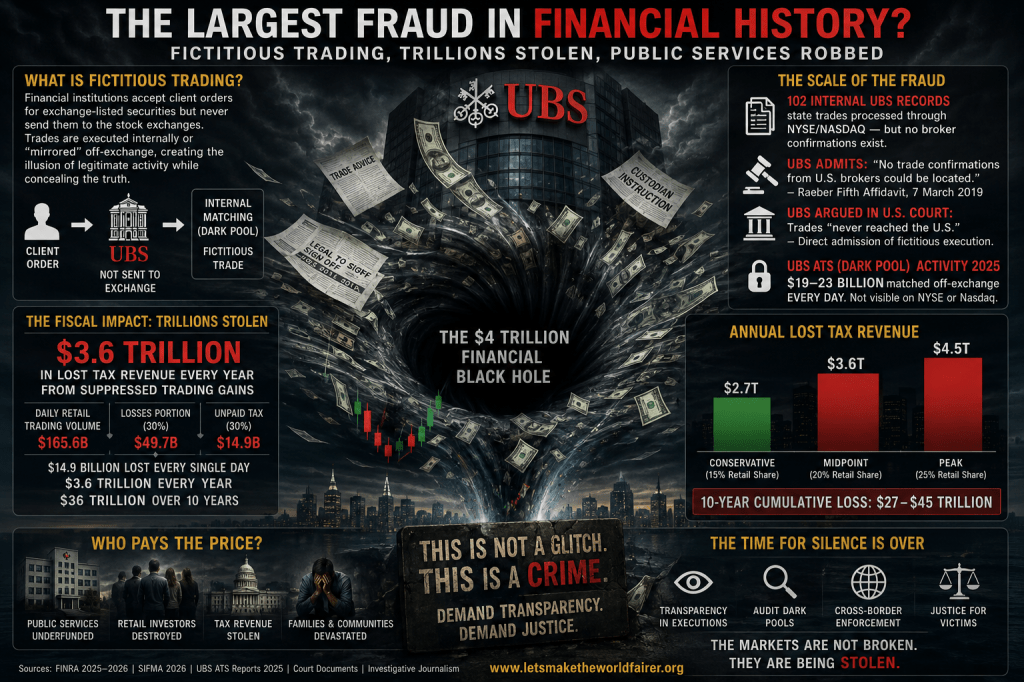
Executive Summary
Fictitious trading occurs when financial institutions accept client orders for exchange-listed securities but fail to transmit them to registered exchanges. Instead, trades are executed internally or “mirrored” off-exchange, creating the appearance of legitimate activity while concealing the absence of market execution. This practice came to light through client cases originating in The Bahamas, including the case of Irina Tsareva and Yuri Starostenko against UBS (Bahamas) Ltd. and UBS AG.
The evidence demonstrates that UBS operated a fictitious trading scheme affecting hundreds of thousands of client orders, generating billions in off-exchange volumes, and potentially depriving governments of trillions in tax revenue.
Section 1: The Scale of UBS’s Fictitious Trading
The Starostenko Case Evidence
| Evidence | Date | Significance |
| 102 internal UBS records | November 2018 | Records state trades processed through NYSE/NASDAQ — but no broker confirmations exist |
| Raeber Fifth Affidavit | 7 March 2019 | UBS admits no trade confirmations from U.S. brokers could be located |
| UBS Internal Memorandum | 13 January 2014 | “Legal to sign off” — records required legal scrutiny before release |
| UBS Jurisdictional Argument in 19-cv-09993-KPF Document 41-1 filed 07-27-20 Page 1 of 29 Memorandum of Law | 2019–2020 | UBS argued in U.S. Court that trades never reached the U.S. — a direct admission of fictitious trading. In particular:a. “UBS AG did not engage in any conduct in New York (or the United States)related to the underlying, “simulated” trades” (Page 9 of 29); andb. “if there were no securities trades, as Plaintiffs allege (id.), then there was noconduct in connection with “the purchase or sale of a security” (Page 18 of 29). |
UBS ATS Volumes (2025)
UBS Securities LLC publicly reports monthly performance metrics for its U.S. Alternative Trading System (ATS) under FINRA Rule 605. The 2025 reports show substantial off-exchange internal matching:
| Month (2025) | Avg Daily Matched Shares | Avg Daily Matched Notional (USD) |
| January | 279,804,907 | $19.08 billion |
| February | 312,399,133 | $21.11 billion |
| March | 316,217,873 | $20.43 billion |
| November | 324,496,267 | $22.83 billion |
Key Finding: UBS ATS matched notional volumes range from approximately $19–$23 billion per day . These off-exchange flows are not visible on NYSE or Nasdaq tapes.
Section 2: Current U.S. Equity Market Scale
Market Volume Data (2025–2026)
| Metric | Value | Source |
| Average daily dollar volume (NMS stocks, 2025) | $828 billion | FINRA 2026 Industry Snapshot |
| Average daily share volume (2025) | 17.6 billion shares | FINRA/SIFMA |
| Average daily notional value (2025) | $1.1 trillion | Market data |
| January 2026 average daily turnover | $1.03 trillion | Record high |
| Peak single-day notional (April 9, 2025) | $1.86 trillion | Tariff announcement |
The U.S. equity market has entered a new era of **$1 trillion+ average daily trading**, up from the $500–700 billion range in prior years . This represents a 50% year-over-year increase in dollar volume.
| Source | Retail Share | Period |
| Jefferies Analysis | >20% of volume | 2025 |
| JPMorgan | 20–25% of activity | 2025 |
| Industry Reports | 20.5% of U.S. daily equity volume | 2025 |
| JPMorgan (Q1 2026) | 17% (rebound expected) | 2026 |
| Edison Group | 20–25% consistently; 35% at peak | 2025 |
Section 3: Retail Trading Share of Market Volume
Retail Participation (2025–2026)
Multiple authoritative sources confirm retail investors now represent a substantial and growing share of U.S. equity trading:
Conservative Working Figure: 20% retail share of daily U.S. equity volume.
Section 4: The “Black Hole” Fiscal Impact Calculation
Direct Tax Revenue Loss Estimate
Using current market data as of 2026:
Step 1: Daily Retail Trading Volume
- Total average daily dollar volume (NMS stocks): $828 billion (2025 FINRA data)
- Retail share: 20%
- Daily Retail Trading Volume = $828B × 20% = $165.6 billion/day
Step 2: Losses Portion
- Industry studies indicate approximately 90% of retail traders experience net losses
- However, losing traders do not represent 90% of retail capital — professional or algorithmic participants control larger balances
- Conservative assumption: losing retail segment represents 30% of total retail trading capital
- Losses Portion = $165.6B × 30% = $49.7 billion/day
Step 3: Unpaid Tax on Suppressed Gains
- Assume 30% effective tax rate on what would have been legitimate taxable gains
- Daily Lost Tax Revenue = $49.7B × 30% = $14.9 billion/day
Step 4: Annualized Impact
- 240 trading sessions per year
- Annual Lost Tax Revenue = $14.9B × 240 = $3,576 billion ≈ $3.6 trillion/year
Conservative vs. Midpoint Scenarios
| Scenario | Retail Share | RTVD | Losses Portion | Annual Tax Loss |
| Conservative | 15% | $124B | $37.2B | $2.7 trillion |
| Midpoint | 20% | $165.6B | $49.7B | $3.6 trillion |
| Peak | 25% | $207B | $62.1B | $4.5 trillion |
Section 5: Decade-Scale Projection
| Scenario | Annual Loss | 10-Year Cumulative |
| Conservative | $2.7 trillion | $27 trillion |
| Midpoint | $3.6 trillion | $36 trillion |
| Peak | $4.5 trillion | $45 trillion |
Section 6: UBS-Specific Evidence and Role
Verified UBS ATS Data
UBS’s ATS (Alternative Trading System) represents one of the largest dark pools in the U.S. equity market, alongside Citadel Connect, Virtu’s MatchIt, and Goldman Sachs’ Sigma X2 .
UBS ATS Activity (2025):
- Average daily matched notional: $19–23 billion
- Peak daily matched notional: > $22.8 billion (November 2025)
- Total symbols active: 12,075
- Average daily matched shares: 324 million
Significance
These off-exchange flows represent approximately 2.3–2.8% of total U.S. equity market activity. Importantly:
- These are matched trades — internally crossed buy and sell orders without exchange submission
- They are not visible on NYSE or Nasdaq tapes
- UBS argued in U.S. court that trades “never reached the U.S.” — a direct admission of fictitious execution
Section 7: Policy and Enforcement Recommendations
To prevent continuation of fictitious trading and off-exchange internalization:
- Enhanced routing transparency — Mandatory disclosure of execution venue for all client orders
- Mandatory ATS internalization ratio disclosure — Percentage of client orders executed without exchange submission
- Independent audit of off-exchange matched trades — Reconciliation against exchange clearing data
- Cross-jurisdictional cooperation — Financial crime units in The Bahamas, U.S., Switzerland
Section 8: Secondary Damages (Excluded from Estimates)
The $2.7–3.6 trillion annual loss reflects only direct fiscal impact and excludes:
- Market integrity erosion — Price discovery distortion, investor confidence loss
- Unpaid exchange and clearing fees — Reduced revenue for transparent market infrastructure
- Job displacement — Lost livelihoods in legitimate market services
- Mental health crisis — Psychological distress among retail traders
- Global trust deficit — Erosion of international confidence in financial regulation
Section 9: Media coverage
1. The first – a detailed investigative report by Lucy Komisar*, one of the most respected independent investigative journalists in the field of international financial crime, banking fraud, offshore systems, and regulatory abuse.Inside Paradeplatz (Switzerland) – August 2024 2. The PostilMagazine (USA) – September 2024 3. Project Censored (USA) – March 2025 4. Brabants Dagblad, founded in 1771, (Netehrlands) – March 2026.
* Gerald Loeb Award (2010) Academy Award for Best Documentary Feature Film (2023)
This website has tens of thousands of views in 106 countries as of today – please see the map below. This has been achieved without us ever having organized any promotional campaign, since we do love The Bahamas and our case, until won, could create a negative image of the country which we are aiming to avoid.
Sources
- FINRA 2025 Industry Snapshot — Average daily dollar volume $828B for NMS stocks
- FINRA 2026 Industry Snapshot — U.S. stock trading hit record levels in 2025
- JPMorgan Analysis (2025–2026) — Retail share 20–25% of activity, peak 35% in April 2025
- Jefferies Note (December 2025) — Retail >20% of volume, higher among low-price names
- UBS ATS Monthly Volume Summaries — Available at ubs.com/ats
- SIFMA Capital Markets Fact Book 2026 — U.S. equity ADV and market structure
- Cboe Global Markets — Historical market volume data
Disclosure
This document was prepared based on publicly available data, including regulatory filings, FINRA and SIFMA reports, UBS-published ATS statistics, and investigative journalism. The calculations represent estimates based on conservative assumptions and industry-standard methodologies. The 90% loss rate, 30% tax rate, and retail share assumptions are stated openly — changing these assumptions would materially change the resulting figures.
Prepared by: Independent Financial Transparency Initiative
Date: August 2026
Contact: irastaro@gmail.com
Website: https://letsmaketheworldfairer.org


[…] Fictitious trading is not a technical breach. It is fraud: a bank takes your money, pretends to execute your trades, and creates fake records to conceal the deception. UBS Bahamas took over 252 of our trade orders, never sent a single one to the NYSE, and UBS AG fabricated 102 internal records to hide the scheme. When we demanded proof, UBS admitted in a sworn affidavit that it had no trade confirmations from U.S. brokers — proof that the trades were never executed. That evidence has been before the courts in The Bahamas and the United States since 2019, yet it has never been examined on its merits. You can see the full details and its trillion-dollar impact in this report. […]
LikeLike
[…] During these years of litigation, we have obtained proof of this massive fraudulent scheme — evidence that, once examined by the Court, will impact the global financial world. All people, like you and I, will benefit. Financial criminals will lose a significant part of their revenue. For more details, please see this report. […]
LikeLike